Use Google Analytics Data To Take Your Business To New Heights

Post by Kristin Rooke, Senior Account Manager
How do you make decisions when it comes to your online business? Do you base them on a gut feeling or on conversations that you have with your customers?
While there’s a lot to be said for instinct and customer feedback, if you’re not looking at your website data then you’re missing out on a wealth of opportunities to grow your business.
Are You Using Google Analytics?
We’ll go over the basics and some industry-specific tools but before we get there, here’s a quick rundown:
Google Analytics is a freemium (free and premium) website analytics tool that tells you how well your website is performing. You can track:
- the number of users that visit your site
- how they find you
- what device they’re using
- where customers drop off when exploring your site
In short, it provides incredibly valuable information about what’s working and what isn’t when it comes to your online business. When you know your strengths and weaknesses, you can optimize your site to more effectively convert your users (get more customers to buy your experiences, making you more money).
Getting Started With Google Analytics
Before we dive into a few Analytics reports, let’s first address a critical question—do you have a Google Analytics account?
If the answer is no, then your first step is to set up an account and install your unique tracking code on your website.
The process of adding the tracking code to your website varies depending on the type of content management system (CMS) you’re using. The list below includes the most common CMS’s and a link to step-by-step instructions on how to add the Google Analytics tag for each:
– WordPress
– Squarespace
– Weebly
– Wix
– Joomla
If you’re a FareHarbor client and you’d like help adding your tracking code to your website the correct way, or if you’re using a different type of CMS, reach out to our Support Team and we can install Google Analytics on your site for you.
5 Essential Google Analytics Reports To Assess Website Performance
After you add your Google Analytics tag to your website, it can take between 24-72 hours to start collecting user data. Even after you begin seeing data in your account, you’ll probably want to wait until you have at least 1-3 months of information before making any conclusions.
Once you’ve collected a few month’s worth of data, you can start digging into your reports to identify trends. These five reports give you a basic rundown of what your site is doing well, and what needs to be optimized.
1. Audience Overview
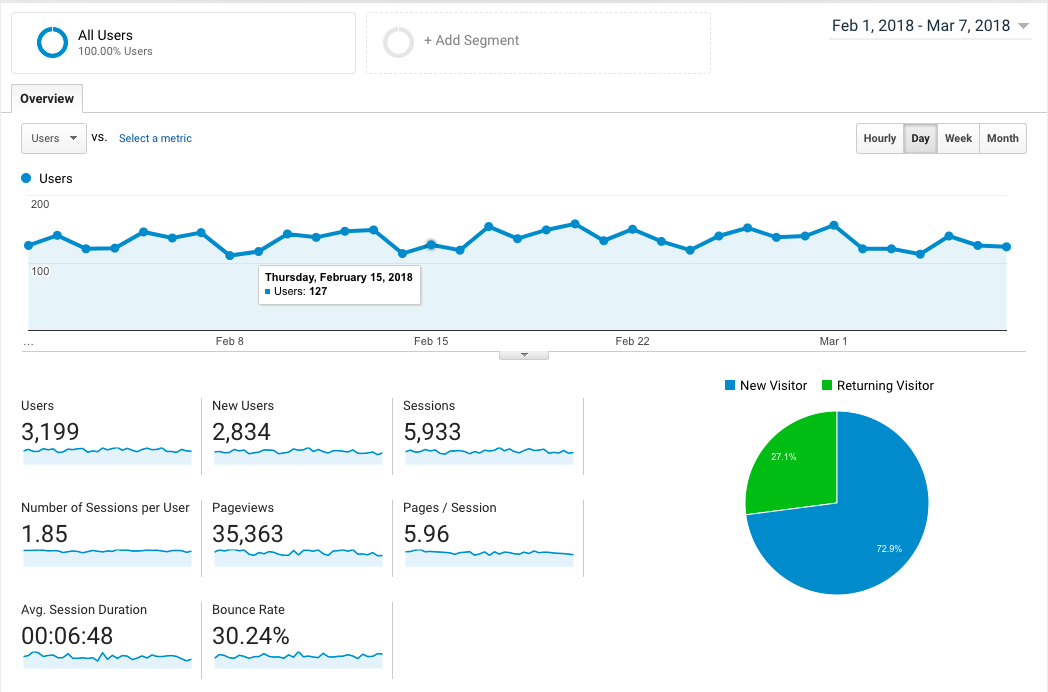
The Audience Overview report gives you a broad look at overall website performance. This report shows you things like:
- how many people visit your website per day
- the number of new versus returning users
- and your average website bounce rate for the specified period of time
Let’s explore two key numbers here:
Website Traffic
Before talking numbers, there are two key terms you should understand—users and sessions.
A website user is a unique person that visited your website. A user is considered “new” when they’re visiting your site for the first time. Returning users have visited your site before.
When a user visits your website they trigger a session, which is the duration of time they spend clicking on and navigating around your site. By default, sessions will time out after 30 minutes of inactivity. If the user clicks something else on your site after being inactive for 30 minutes, it starts a new session.
So, one user can have multiple sessions on your site.
In the example above, we’re looking at website data from February 1, 2018 – March 7, 2018. If you hover over a point on the line graph, you’ll see the total number of website users on that day. In this case, you can see that 127 people visited the site on February 15th.
Depending on your domain and page authority, overall SEO, and social and digital marketing strategy, you might have more or fewer daily visitors to your site.
FareHarbor client? If you’re concerned about your website traffic and want to strategize ways to increase the number of users visiting your site per day, get in touch with us. We can assess your current website SEO and user engagement strategy.
Bounce Rate
A “bounce” is when a user visits your website and takes no additional action before leaving your site. For example, a user lands on your homepage and leaves without clicking on any other pages or buttons.
How does your bounce rate compare to other businesses? Let’s break it down:
- Bounce rate of 0-15%: Usually a sign of bad data.
Very low bounce rates often mean that your Google Analytics tag is improperly implemented on your website and that you’re not collecting accurate user data. Definitely check to make sure that your tag has been added to your site correctly.
- Bounce rate of 16-40%: Excellent bounce rates.
The users visiting your site are high-quality leads and are interested in your tours and activities.
- Bounce rate of 41-60%: Average bounce rates.
Your website is performing well for you but bounce rates closer to 60% indicate there’s room for improvement.
- Bounce rate of 61-90%: Poor bounce rates.
Your website could use some serious optimization. Is your site mobile-friendly? Is it easy for the user to navigate? How many clicks does it take to make a booking? Do you have too much or too little website content?
If you look at the report above, the average bounce rate for the website is 30.24%. This is an excellent bounce rate, so we can assume that overall the website is attracting high-quality leads.
Now that we have a basic understanding of this website’s bounce rate, let’s dig a little deeper by looking at bounce rates across devices.
2. Mobile Overview
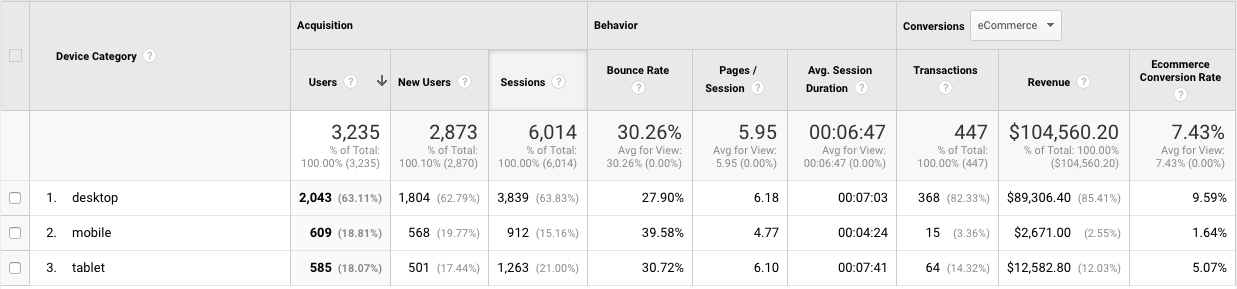
The Mobile Overview report breaks down how your website is performing on different devices — specifically desktop, mobile, and tablet.
Why is this valuable? Because your website might do well on desktop but not on mobile (or vice versa). In a world that is becoming increasingly mobile-dependent, having a mobile-friendly website is essential.
If you take a look at the data above, what observations can you make? Here are a few big takeaways:
- Most users visiting the site are on desktop (63.11% of traffic). Mobile users are second, followed closely by tablet users.
- The bounce rate is lower for desktop users (27.90%), and much higher for mobile users (39.58%).
- Desktop users have the highest Ecommerce Conversion Rate (9.59%), whereas mobile users have the lowest Ecommerce Conversion Rate (1.64%).
What can you conclude from this data? This website could benefit from improving the mobile experience. If it increases its mobile-friendliness, it could generate more revenue from users on mobile devices.
3. Acquisition Overview
Do you know where most of your website traffic is coming from? Do most of your users find you via organic search or are they finding you through social media?
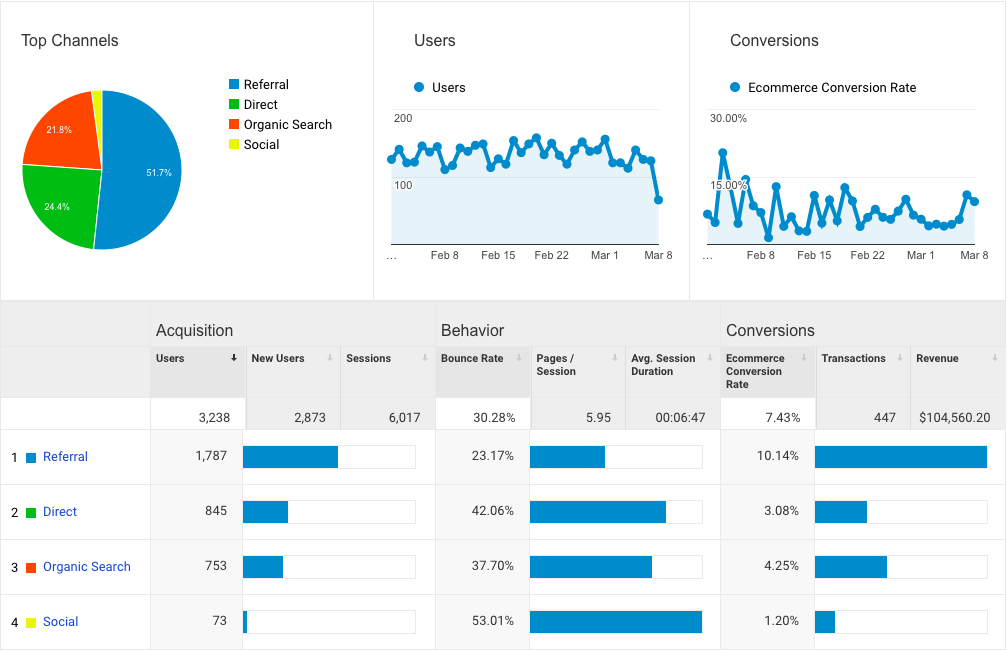
The Acquisition Overview report answers all of these questions. In looking at this report, you can see that there are four primary channels driving traffic — organic search, direct, referral, and social. If you’re doing search or display advertising, you’ll see those show up as channels here too.
What are each of these channels?
- Organic Search: When users find your website by typing keywords into Google (or a different browser).
- Direct: The user types your domain into the browser bar to get to your website or uses bookmarks.Keep in mind, if Google Analytics can’t recognize the traffic source of a visit, it will categorize it as direct traffic. So as much as 60% of direct traffic is usually organic search or referral. This is known as “Dark Traffic” since its true source is veiled.
- Referral: When users find your website by clicking a link on a different website. For example, if a customer clicks your website link on Yelp, then Yelp is the source of the referral.
- Social: When users find your website from a social media page, such as Facebook.
Your top traffic channels are also influenced by your Domain and Page Authority, overall SEO, and your social media or digital marketing engagement strategy. When your website has solid authority and good SEO, your top channel will probably be organic search.
In the example above, you can see that referral is driving the most traffic to this website. The site could probably benefit from improving their website SEO to drive more organic search traffic.
4. Behavior Flow
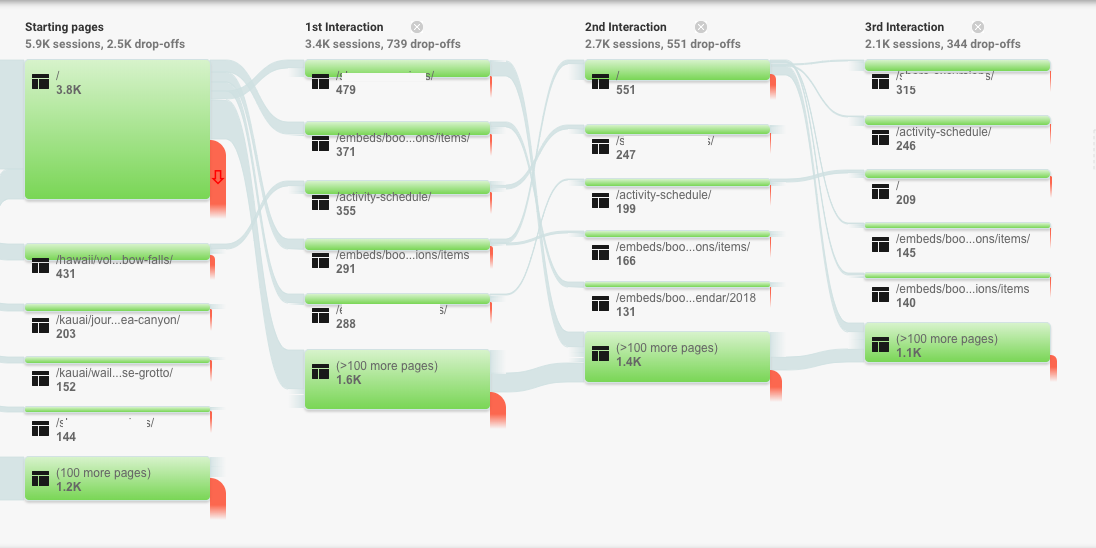
Want to know how users are flowing through your website? The Behavior Flow report shows you where users land on your site and which pages they visit during their session. The starting pages are the pages that users land on and each interaction thereafter is the next page along their journey.
Ideally, we like to see customers enter the booking funnel within 1-3 clicks.
If you’re using FareHarbor, you can tell when a customer enters the FareHarbor book form by the URL strings that include /embeds/.
If you take a look at the Behavior Flow above, you can see that the top landing page is the homepage. This is normal and usually the ideal case scenario from a conversions perspective.
You can also tell that customers are entering the booking funnel within the 1st, 2nd, and 3rd interactions on the site. This means that the user experience on this site is pretty clean and users are finding the information they’re looking for.
Take a look at your own analytics. How many clicks does it take for your users to enter the book form?
5. Ecommerce Overview
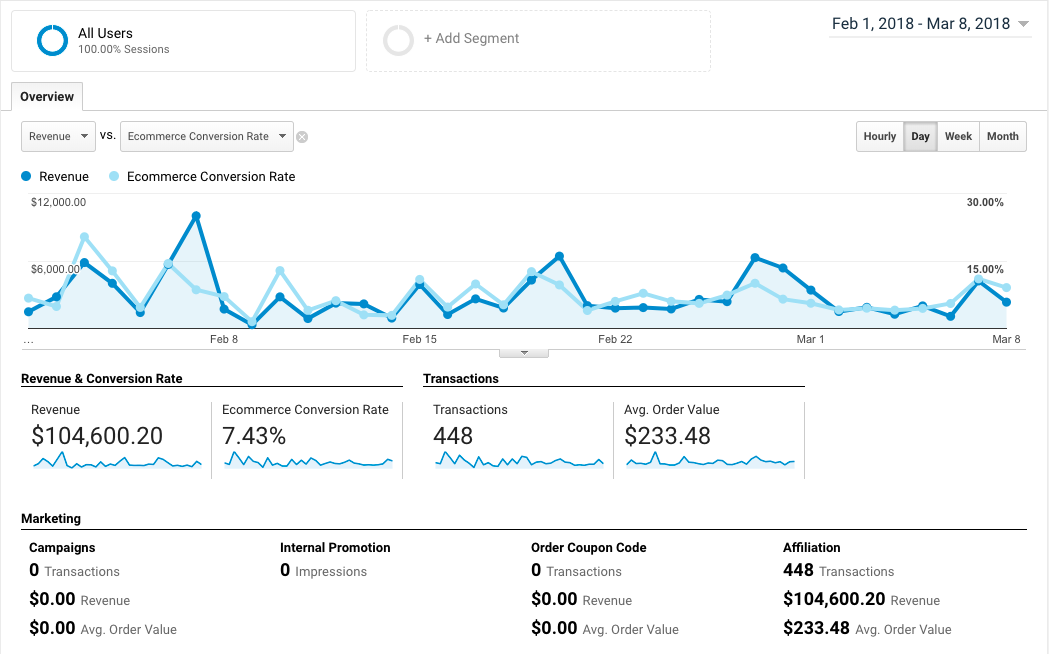
The Ecommerce Overview report is where you can view and track your website performance from a conversion standpoint. First, let’s chat about what your Ecommerce Conversion Rate is.
Your Ecommerce Conversion Rate is the percentage of total website traffic that completes a purchase. So if 100 people visit your site today and 5 people book something, your Ecommerce Conversion Rate for the day is 5%.
The average Ecommerce Conversion Rate for the travel and activity industry is 2.4%. Your Ecommerce Conversion Rate might be different depending on your company type, tour/activity options, and ticket prices. But 2.4% is a good goal to aim for.
If your Ecommerce Conversion Rate is higher than 2.4%, your website is converting very well for you. If it’s lower, you could use the information from the four other reports we’ve explored up to this point to determine the best ways to improve your website and grow your business.
How FareHarbor Can Help
When you work with FareHarbor, you gain unlimited access to our Account Management team.
Trained for your industry, they can help you read and understand your data in Google Analytics, and work with you to identify the top areas of optimization on your website.
FareHarbor’s goal is to help you improve the user experience on your website and increase your conversions.
Our team can take a look at your Google Analytics data, provide you with a website SEO audit, and assess your Dashboard setup to ensure that your booking flow is performing as best as possible.
If you’re already a FareHarbor client, reach out to our team to get the conversation started. If you’re not currently a client, but are interested in what FareHarbor can do for your business, get it touch here!
And, as we say in the office, keep ripping!
All the information found in this post was first shared in our Google Analytics webinar. Exclusive for FareHarbor clients, our webinars go in-depth on topics ranging from Google Analytics to perfecting your website copy.
If you’re already using FareHarbor, stay tuned for the next webinar! If you’re not, what are you waiting for?